Overview
This project demonstrates how physical processes can be monitored, optimised, and automated using IoT, real-time analytics, and AI—reducing waste, manual intervention, and risk.
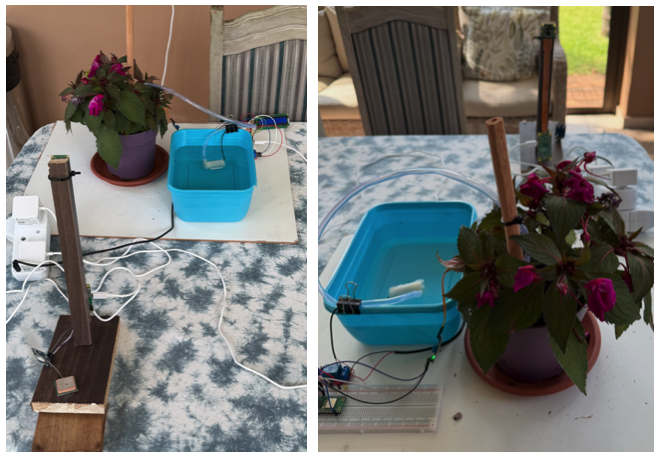
The project is set up around a potted plant, we measure its soil moisture levels and combine that with weather information as well as AI image analysis to trigger watering with a pump at the optimal level.
Sensors allow for more data and accurate data. Data is also gathered at specific intervals. The output from the analysis of this data is then used to trigger events. AI models are used to automate and scale functions that used to require human intervention. Cloud setup allows access in realtime to these results and live information from anywhere in the world.
As a bonus we send out a notification whenever the pump is triggered.
This project showcase how a custom ecosystem can be built to manage and monitor a project. The live app can be viewed here, https://riskcede.shinyapps.io/watering_can/.
Why a plant?
A plant is a safe, inexpensive stand-in for any real-world asset that:
- Has a health state
- Is affected by environmental conditions
- Requires intervention at the right time
- Produces continuous sensor data
This is not a showcase of tools or models, but proof that complex real-world problems can be owned, solved, and operated as a single coherent system.
Physical world → Sensors → Cloud → Models → Decisions → Actuators → Physical world
Components
The following components make up the project.
Data mining server: Data is stored in a database and setup for multiple projects. Analysis is done on the server and data is sent and received through APIs.
Sensors: A soil moisture sensor is calibrated to give a moisture percentage reading from the pot. A threshold is set, if the moisture level drops below this threshold it activates a pump to water the plant. This threshold is varied throughout the experiment to find an optimal level.
Pump: The pump is powered from a different power source. A relay is used to switch the pump on and off at the right time. Once the pump is switched on, it finds the user details linked to the specific pump and sends out a notification to inform them of the event as well as the current readings.
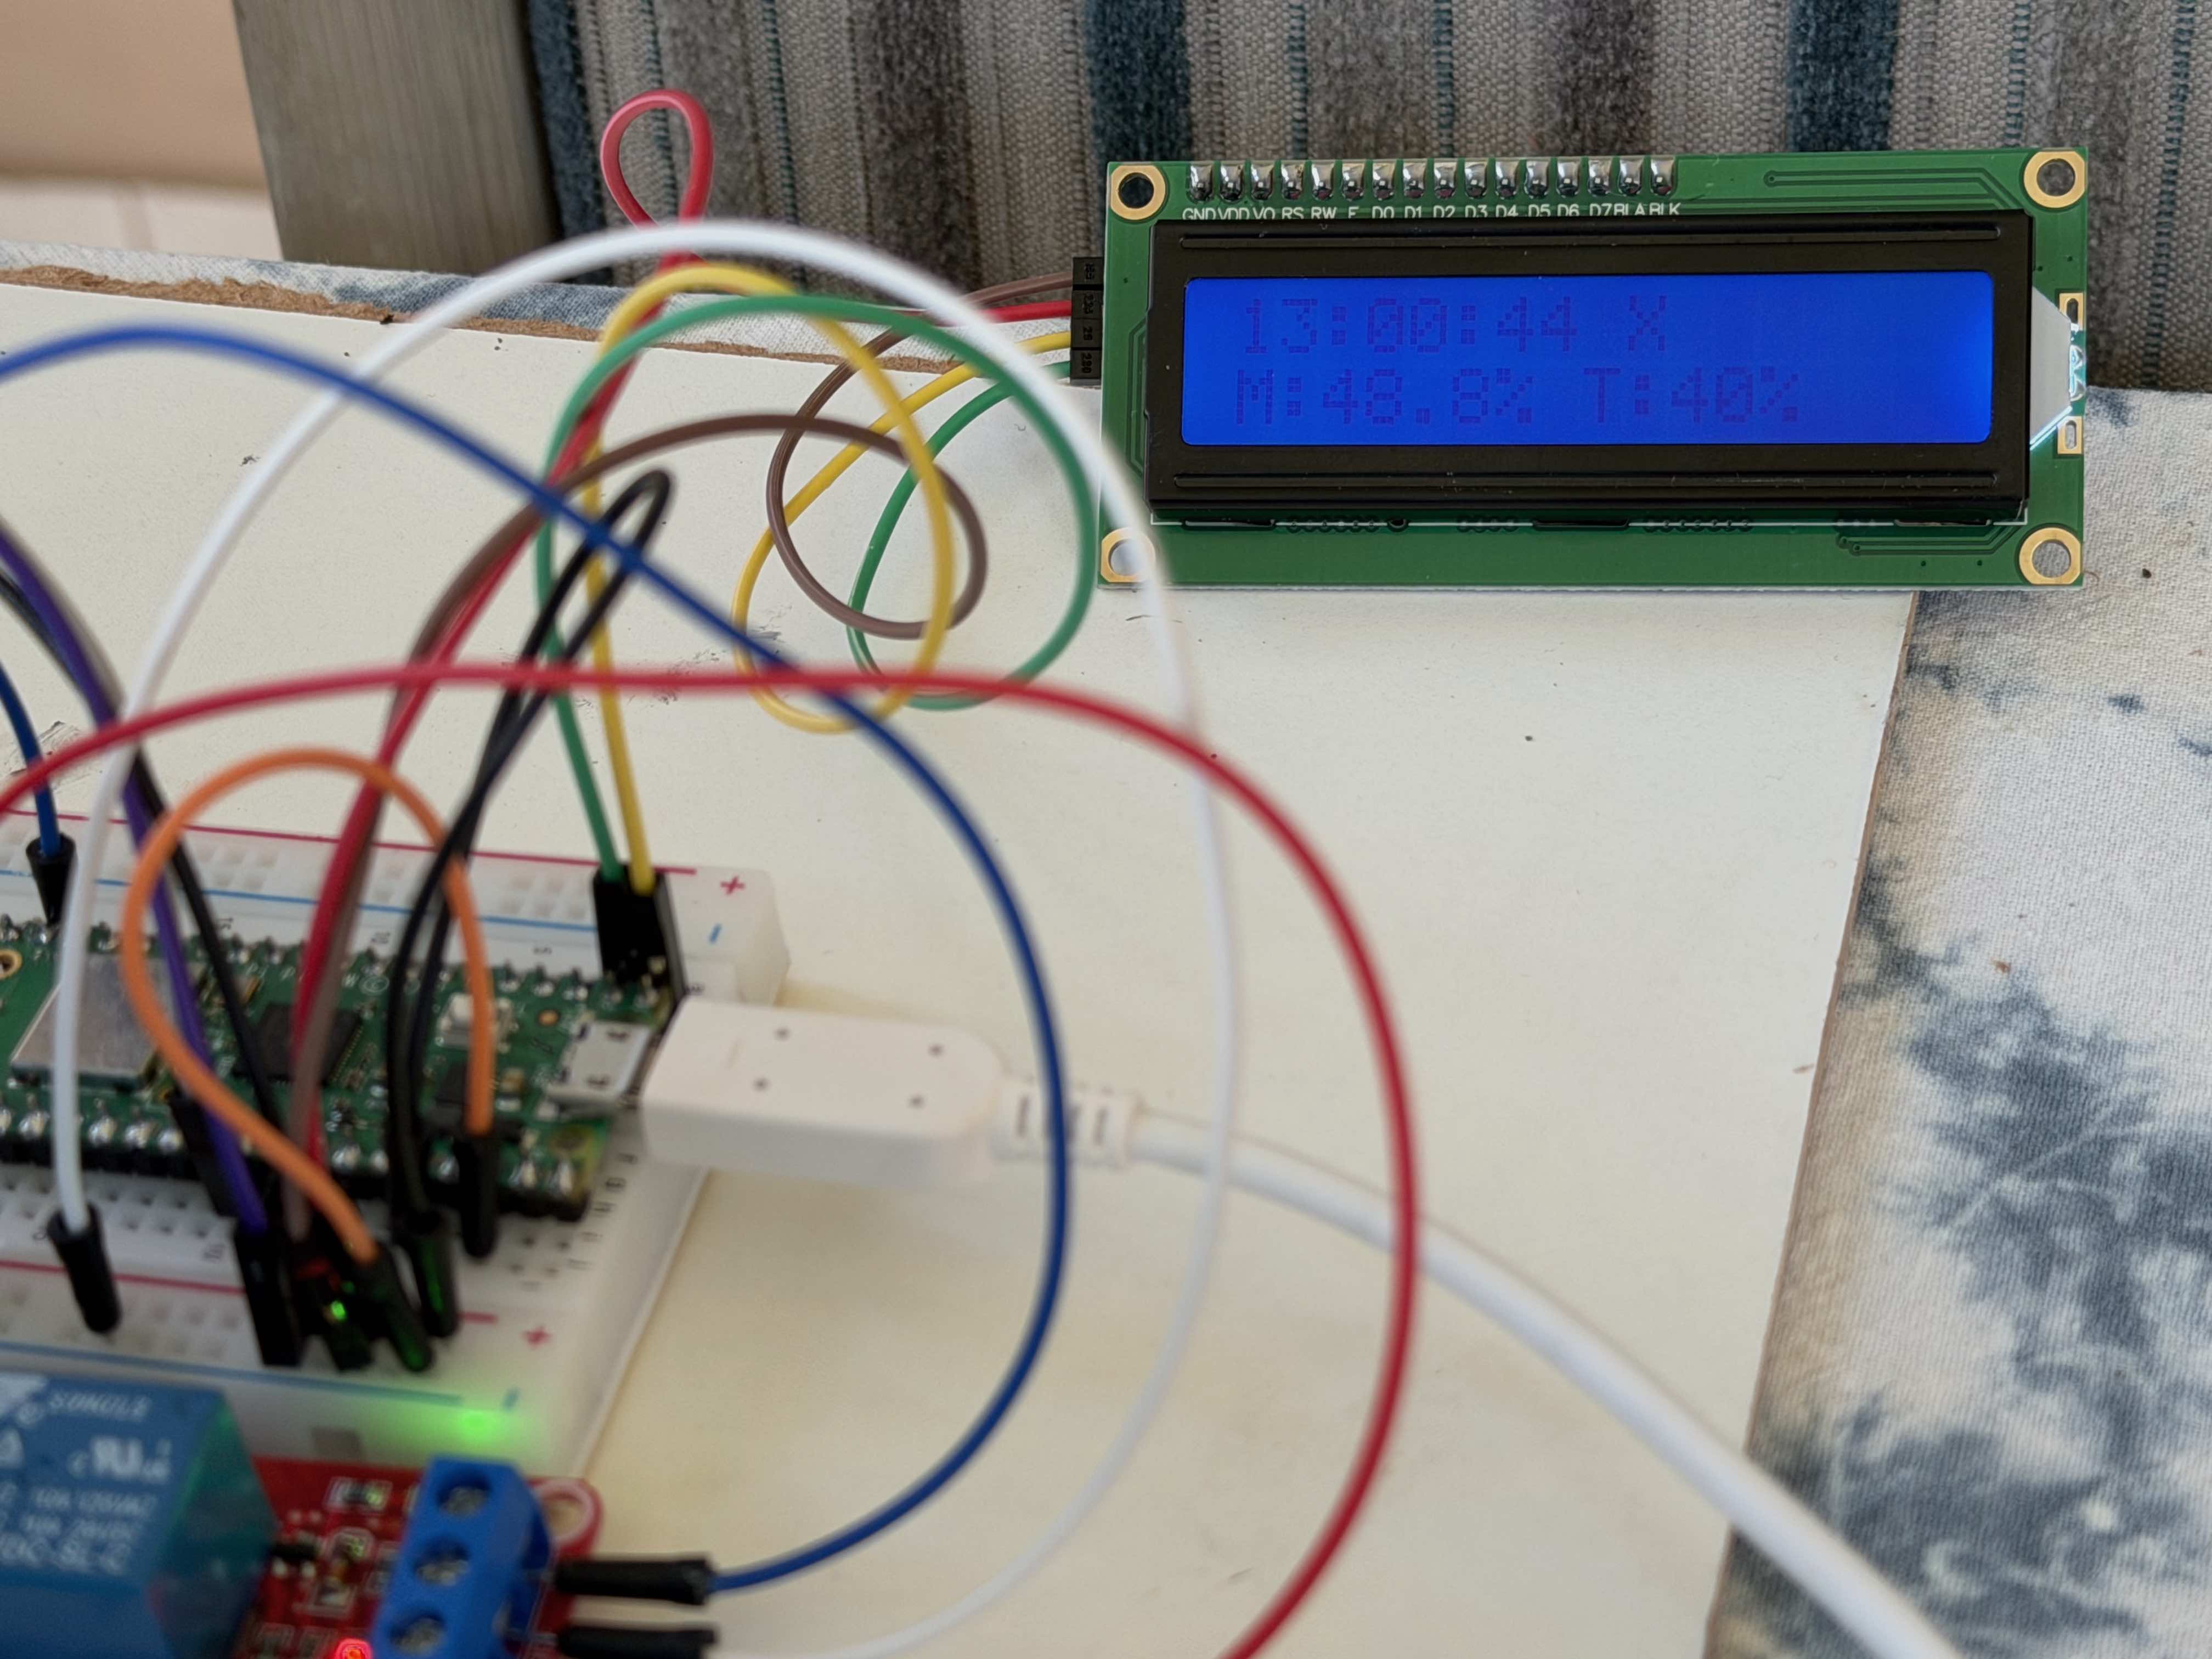
LCD display: An LCD monitor is linked to the micro controllers to show realtime readings and setup information.
GPS: A gps unit is used to get the plants location, although this is statics it does map the various versions weve deployed. This GPS data is then used to gather certain weather information and is stored together with the soil sensor readings.
The GPS and weather module also include automated error modelling. It takes place in tiers, eg if initial results fail or is out of range, a new reading is triggered 1 minute later, if that fails an sms is sent to a user linked to the sensor, if that still fails at the next trigger one hour later and email notification is sent.
Camera: A camera is setup to take hourly pictures. These images is uploaded to the server and shared with an AI model. The AI model classifies the image based on the plants health, specifically related to water.
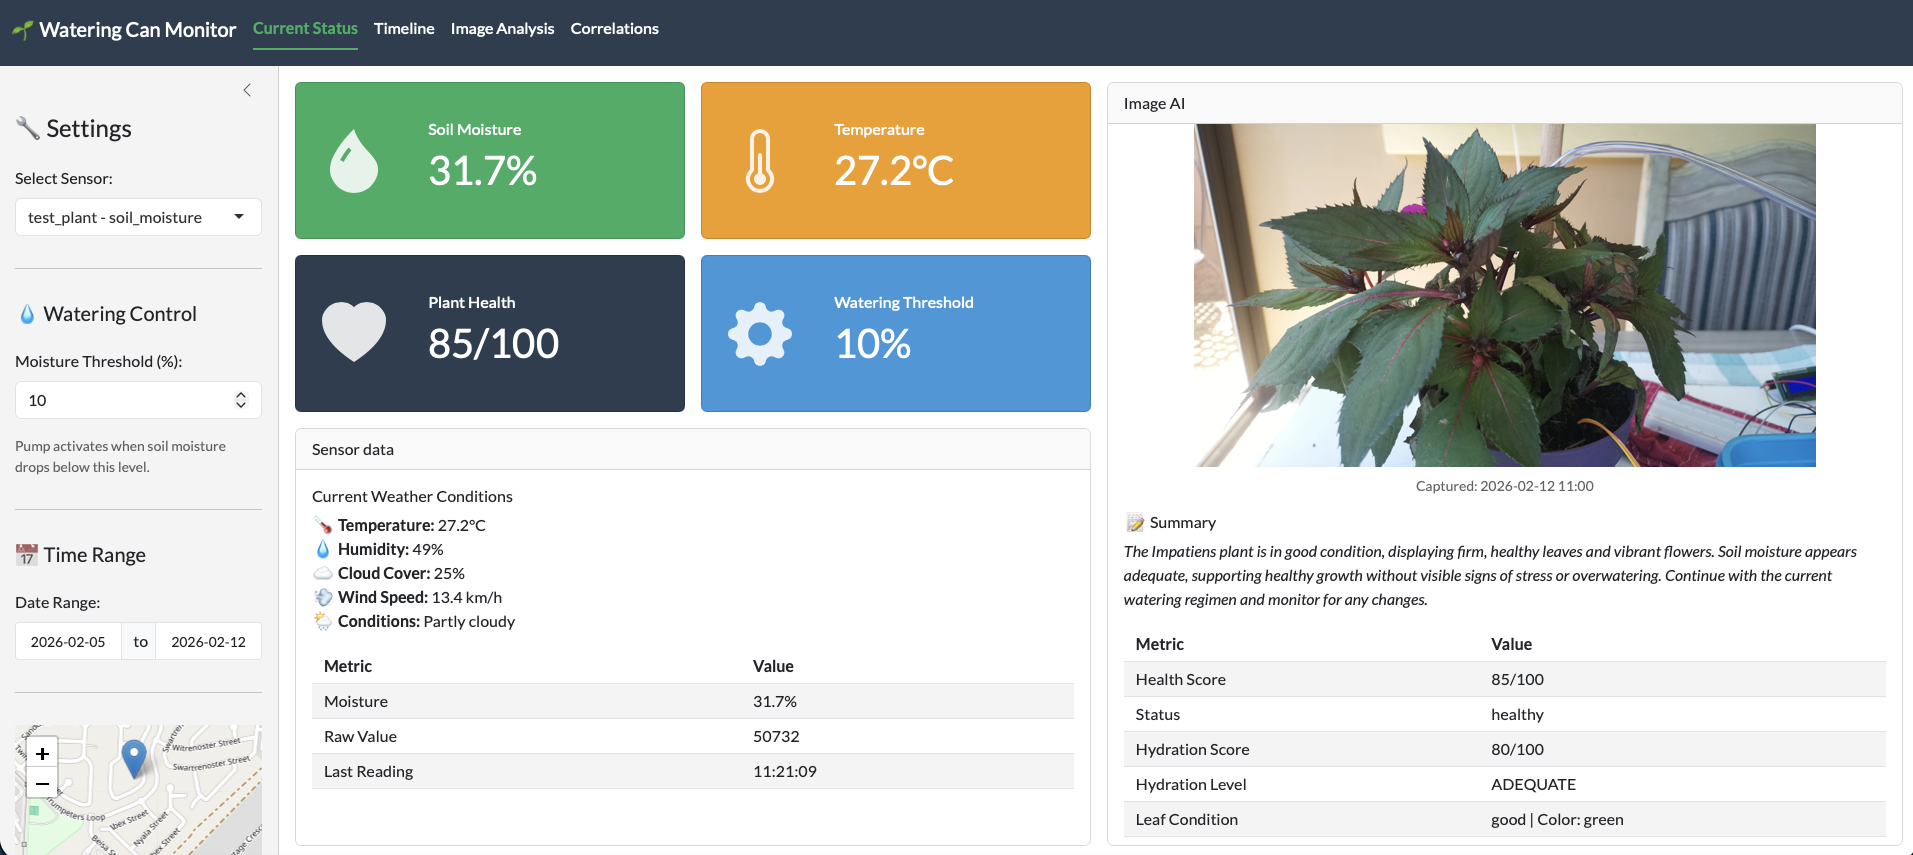
App: All information is available realtime on a web app. Users can view the app from any location to see what is happening at a specific plant.
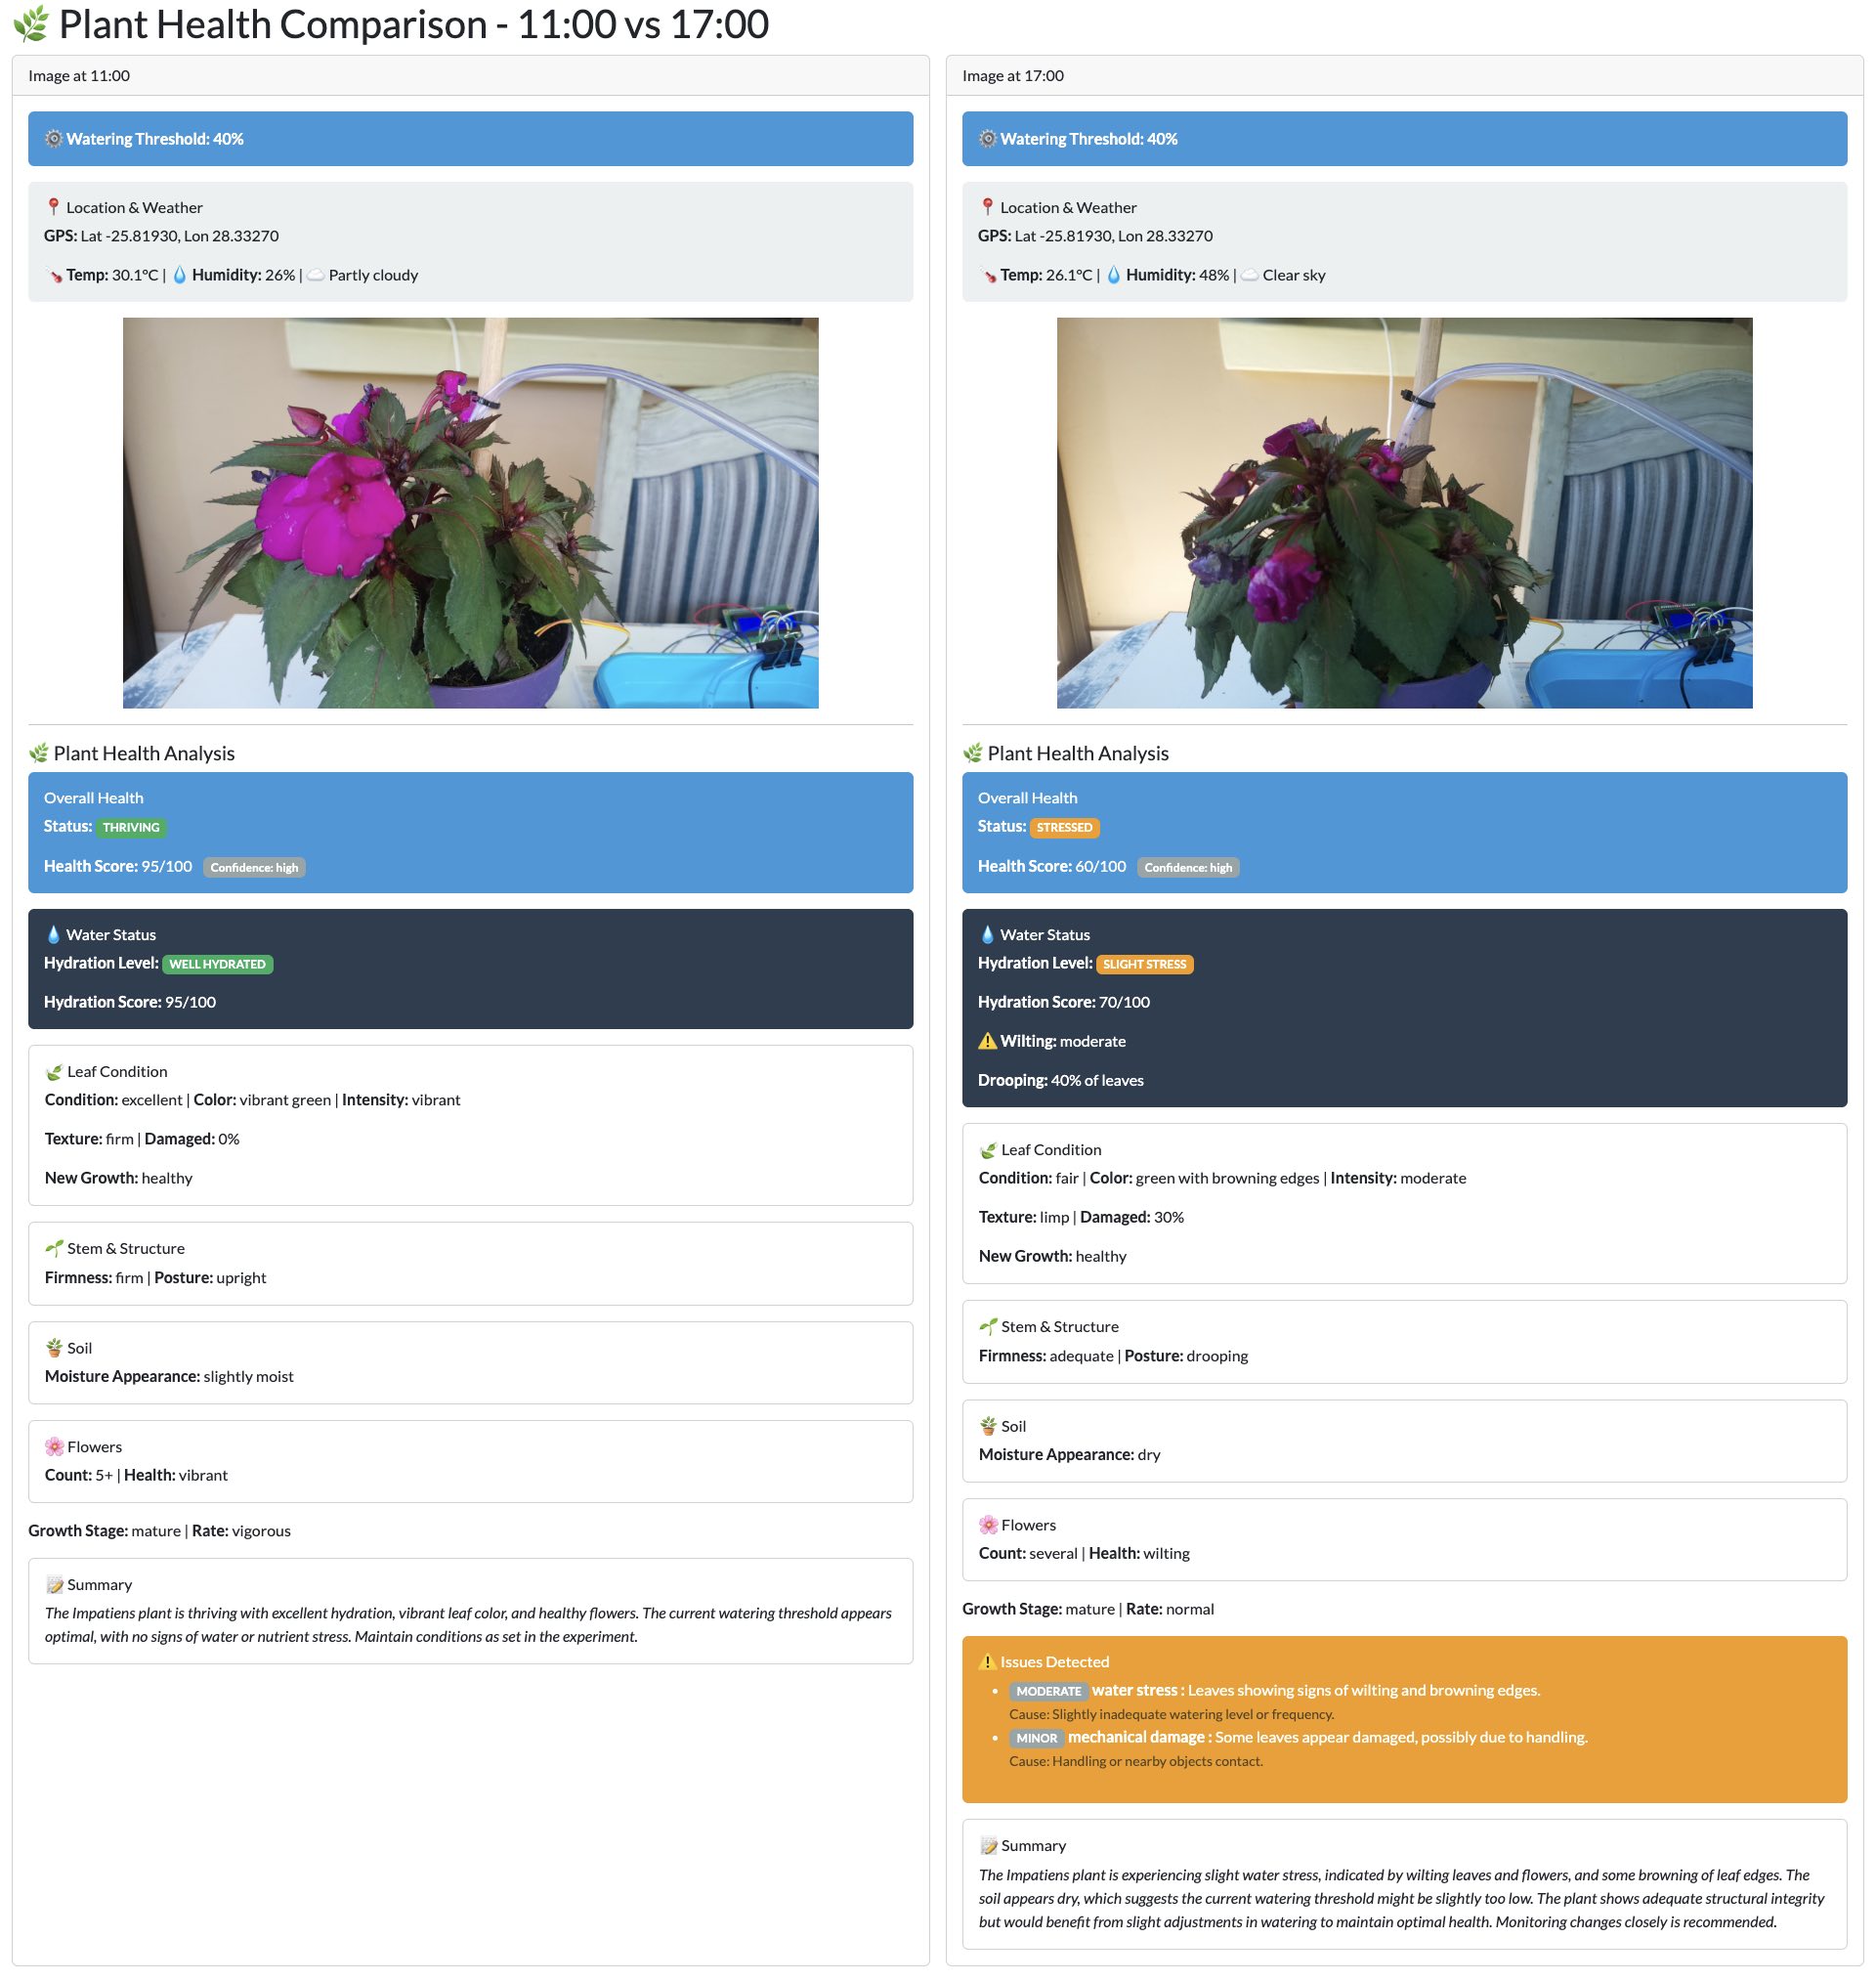
AI image analysis
Images are taken every hour. These images are fed into an AI model in real-time together with a detailed prompt of what to look for and what data and in what structure to send the result. The model returns an overall health score based on the photo. This score is used as a numeric value in the project, eg for the correlation calculations. It also provides a detailed analysis in a structured format.
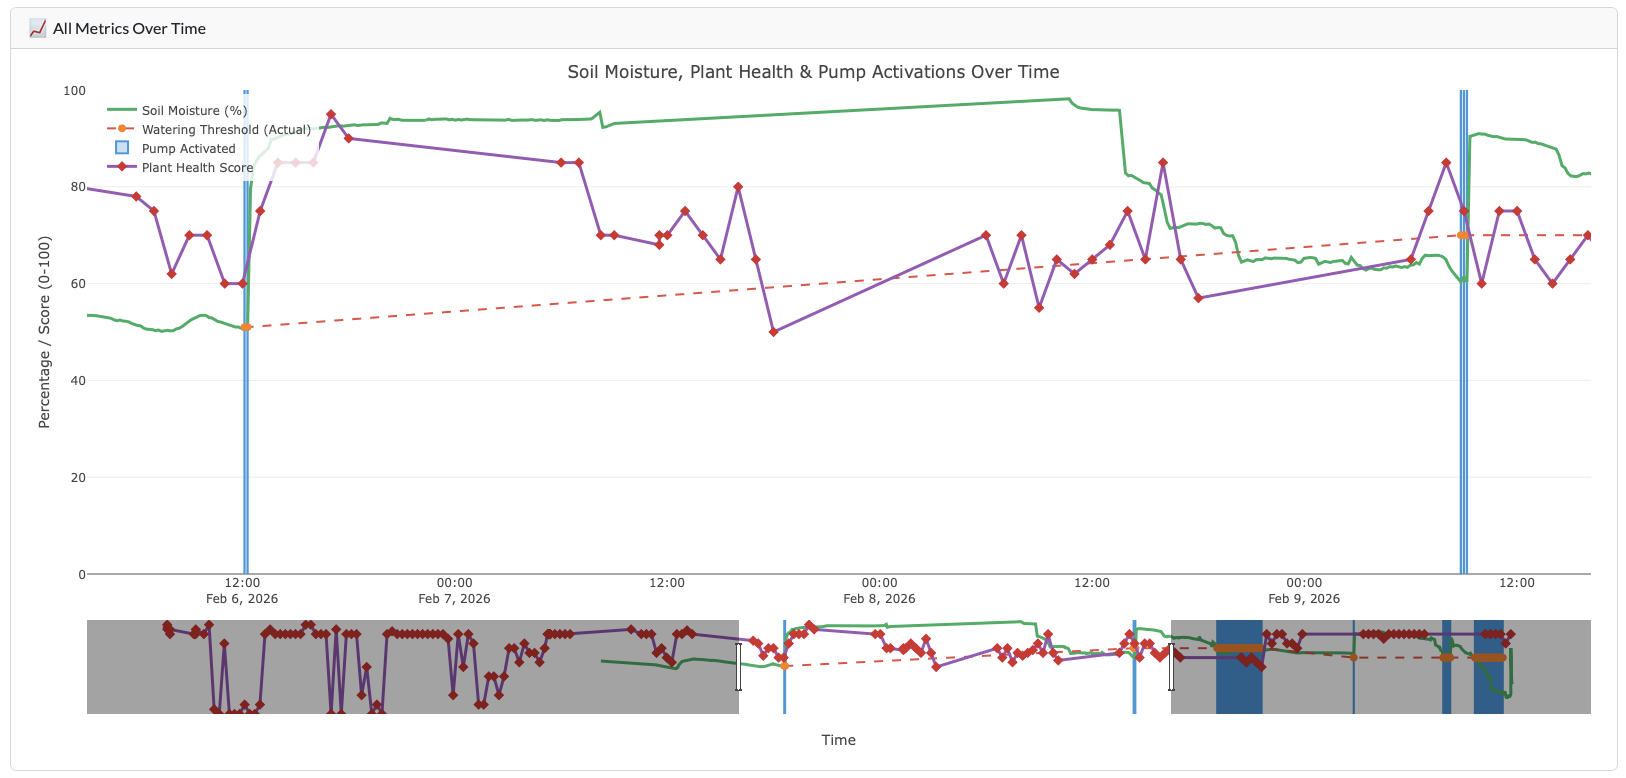
Timeline data
All sensor readings and events, calculated results and AI generated information is linked to the time it occurred and stored in a database. This data is then reported in the application. Although the sensor data is reported at different and sometimes infrequent times, they are mapped to similar buckets.
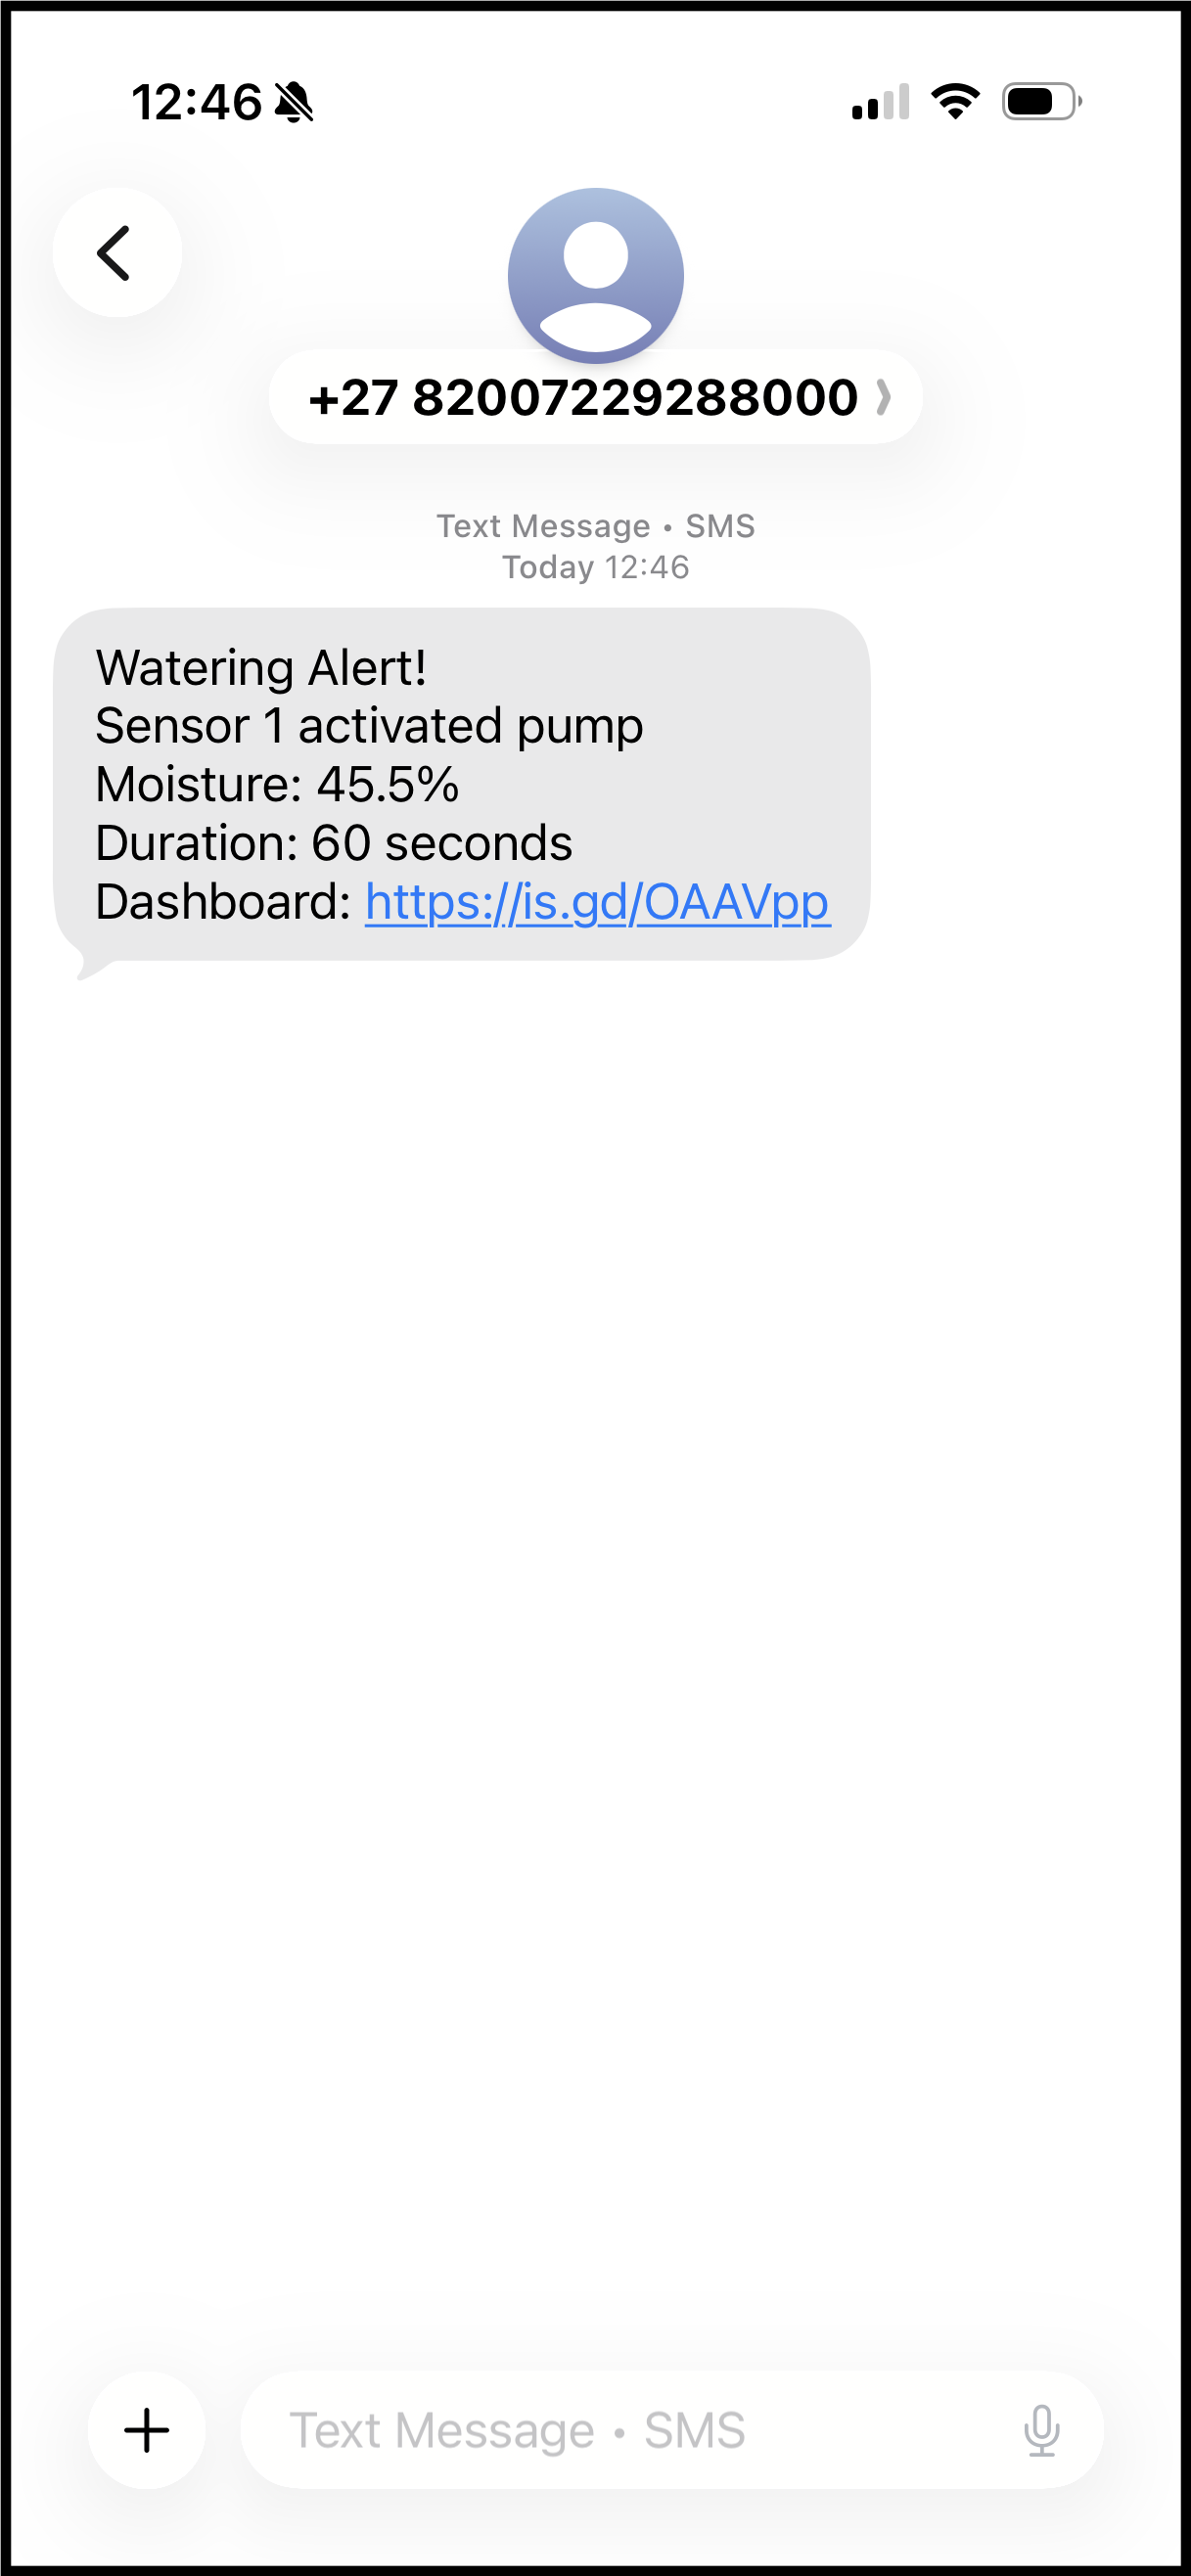
Notifications
The system automatically generates notifications when meaningful events occur, such as pump activations or abnormal sensor behaviour. These notifications include relevant context and direct links to the live system, enabling rapid awareness and intervention when required.
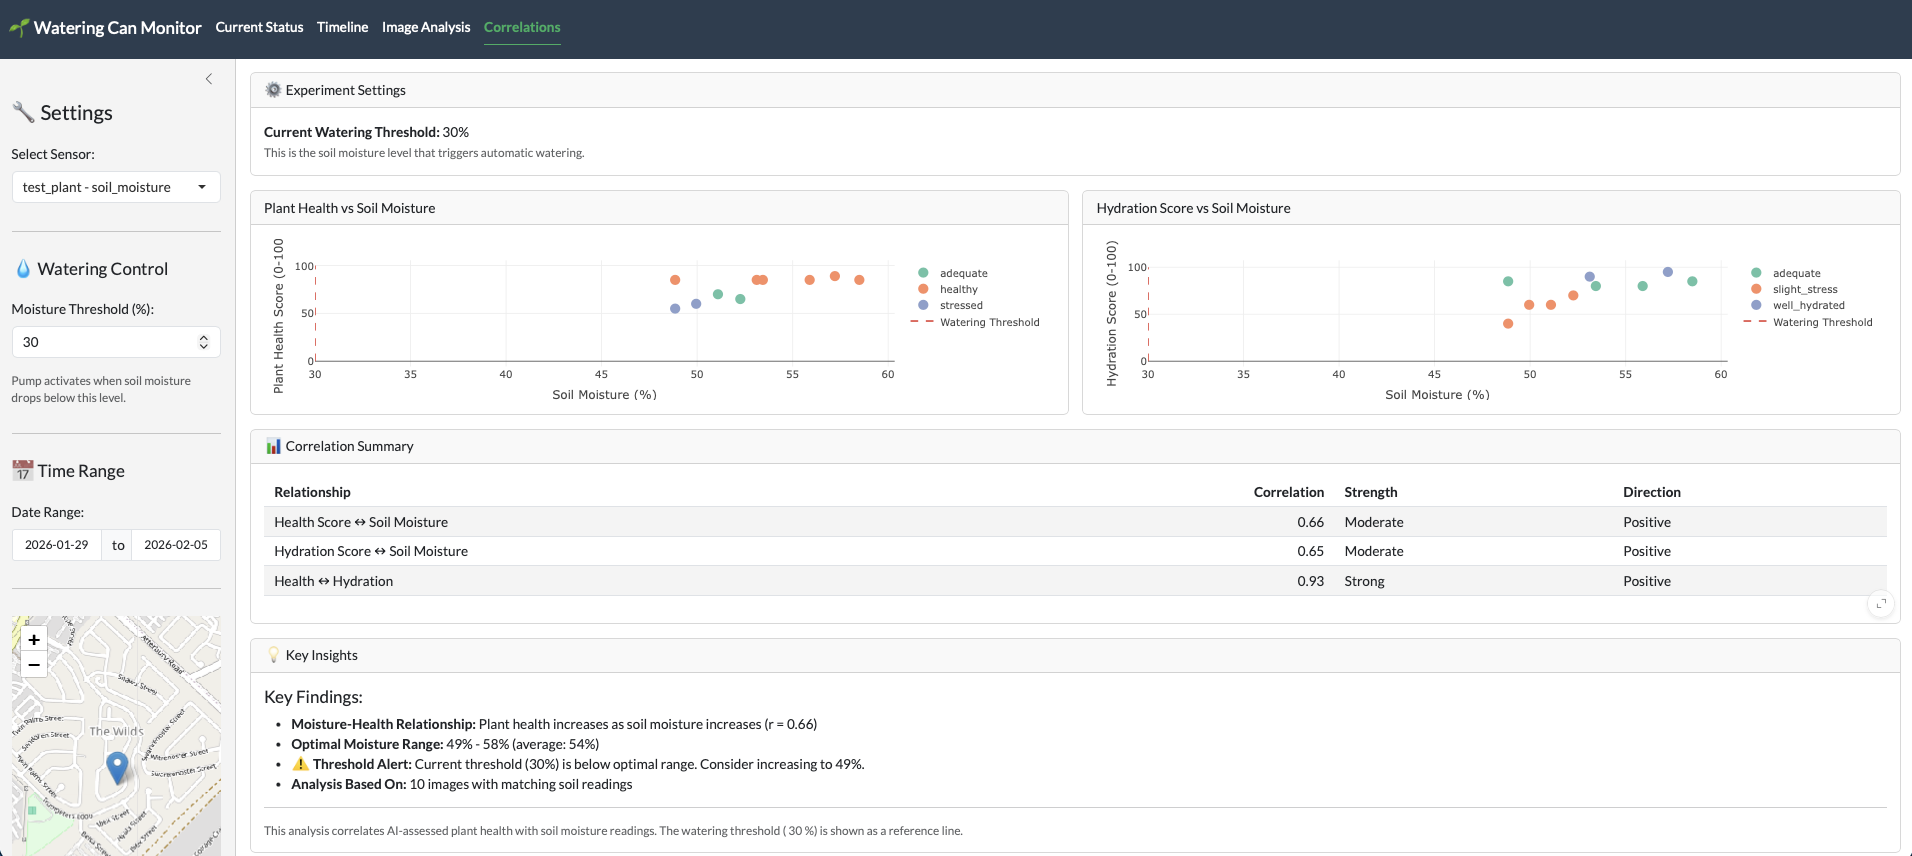
Correlations
In this case some of the correlations will be obvious. But the aim of this experiment was to find the lowest threshold of soil moisture at which we need to add water, while keeping the plant as healthy as possible.
Various calculations are performed on the data, one of which are the correlations between the AI plant health rating and the sensor readings.
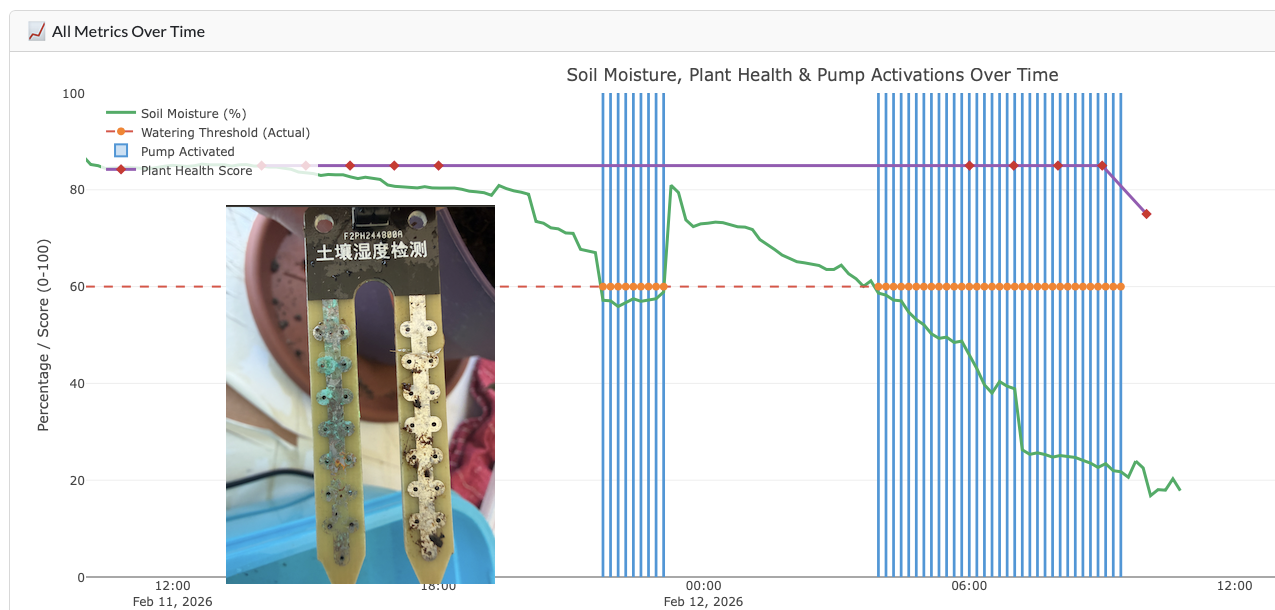
Fault detection
Continuous monitoring allows the system to detect deviations between expected and observed behaviour. When these deviations occur, they are automatically flagged for investigation.
In this example, the soil moisture level continued to decline despite repeated pump activations, indicating that the physical outcome did not match the expected response. This discrepancy was identified as a sensor integrity issue caused by corrosion, and the sensor was replaced.
This demonstrates how the system not only automates intervention, but also validates outcomes and detects failures in the sensing or actuation layers themselves—ensuring the overall reliability of the system.